Waituna Farmers United - the farmers' perspective - |
|
|
|
|
|
... and what about the weather? 26 September 2011:
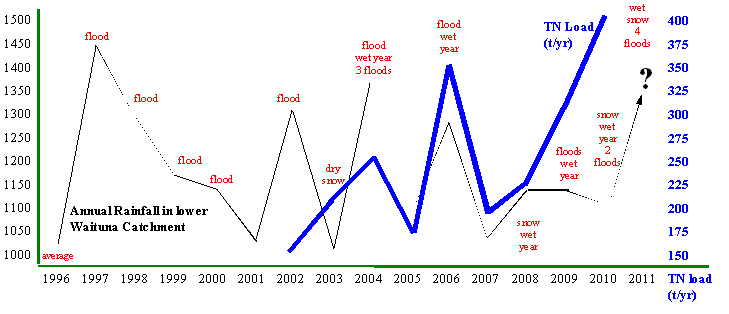
The graph above, supplied by sheep farmer Derek Ballantine, illustrates how the weather, flooding and snow etc... just happens to co-incide with increased loss of nutrients - in this case, in order to keep a complicated subject as simple as possible we have looked only at TN (total Nitrogen). Mr Ballantine says that "the old farmers told us stories of a 10 or 20 year flood cycle at Waituna. "This consisted of three to four wet years then a large flood event, similar to 1982-1984, also 1997-2000 and 2008-2011." And as he said, "we haven't finished this cycle yet."
While 2002 showed a rainfall spike, it was actually a balanced year on the farm and tended to match 2003s nutrient readings which had snow and hailstorms - both of which are believed to increase nitrogen levels.
And of course, floods are known to leach nitrates, as well as cause surface water run-off, erosion and other damage.
As Mr Ballantine says: "The main conclusion is that the nutrients are going up and down with the rainfall and floods, but from 2008, they follow different paths, and are out of balance."
While Waituna Farmers United believe that the weather and monitoring data is statistically important ES has shown little interest in this correlation.
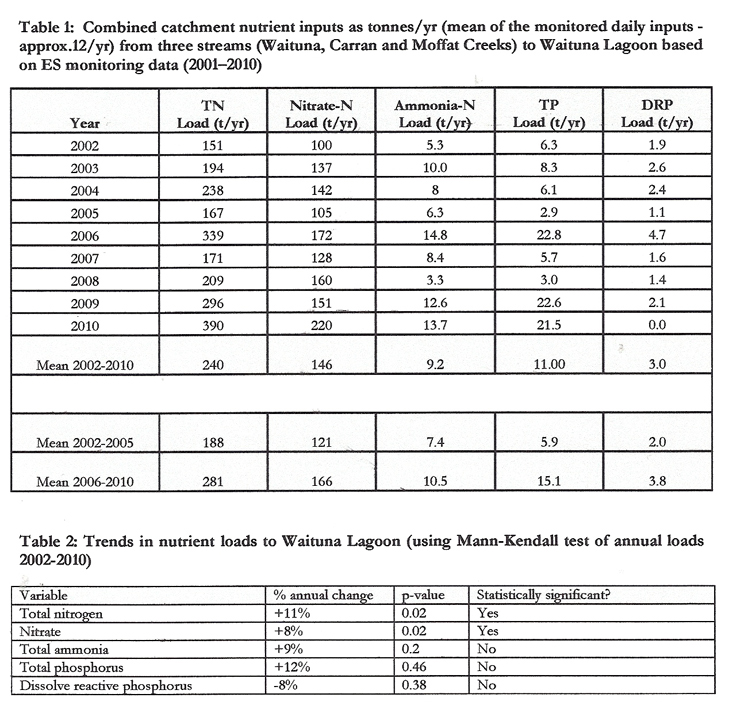
The TN Load is part of information presented by ES detailing "Recent Changes in Nutrient Inputs to the Lagoon."
And, while ES only began collecting water data from all of the main creeks which run into the Lagoon in 2002, the local farmers of the district have been recording information relevant to their environment for decades. It is also important to note that ES has missed out on sediment gauging and flow data to Lake Waituna during 12 high flows and flood events since February 2004, so the the accuracy of their data is likely to be limited - after all 12 tests per year (often missing flood events which occurred at weekends or outside standard nine to five working hours is hardly conclusive).
The graph below is from ES:
It is notable that the mean TN (t/yr) for:
2002-2005 is 188
2006-2010 is 281
- showing an increase of 93 t/yr
and yet, if averages are looked at in a different light... a perfect illustration of what can be done with statistics!!
2002-2006 is 218
2007-2010 is 267
- this shows an increase of 49 t/yr
Article dated Sept 22, 2011
Bearing in mind the weather patterns and flooding events, is it any wonder that the TN has increased? A new report from ES has linked these floods to Climate Change and it is believed that climate change increases problems with floods, snow, drought and also with Algae.
So, while rules might be the order of the day as far as ES is concerned, what about the weather? Farmers can no more control the weather and flood events than the can the erosion from the creeks in the catchment as they try to revert to their natural bends pre Catchment Board straightening in the 50s.
|